As a functional tester, how many times have you come across a hair-pulling bug that seems impossible to replicate immediately, but annoying enough that it intermittently keeps popping up? We know the dilemma; file a bug listing all the data you encountered, but once it comes across a developer’s desk, it gets closed as not reproducible. This is one of the biggest headaches for any tester who is just trying to report issues before the customer does but needs to prove this is indeed a reproducible problem. Good testers look at different angles of the issue to replicate and are successful if they can abide by a few troubleshooting techniques highlighted below.
1. NARROW DOWN THE FOCUSED AREA WHERE THE ISSUE REPRODUCES
Every tester knows the first step to troubleshooting a problem is to perform the same actions and steps again. Then see if it reproduces and if so, assess if the scenario is an actual defect or a temporary relapse in functionality. Those are the easy and obvious issues. But what happens when you try and reproduce the same action and it doesn’t occur again? This is where its best to narrow down the problem. Here are a few practical steps to keep in mind when this happens:
RE-TRACE YOUR EXACT STEPS IN HOW YOU ENCOUNTERED THE ISSUE.
- For example, if a webpage fails to log in after you’ve entered in your credentials, trace backwards to recall which other webpages was touched, account info used, browser tested on, etc.. You’re really trying to determine if the software module around login is busted, or if something else touched earlier affected the previous state that it was working in.
LIMIT THE DEVICES AND PLATFORMS.
- When retesting the scenario, perform the operation on other platforms like Browsers, device OS’s, versions of the build, etc.. Try and narrow down a few affected areas instead of boiling the ocean.
ENABLE LOGGING.
- I’ll mention log captures in the next section, but every product has debugging support to tell you a little more about the problem. Errors aren’t always obvious to the user, so rely on stack traces and error messages to give you a clue where to start.
OBSERVE USER ERROR.
- Occam’s Razor states that the simplest answer is often preferred. It may be a bit embarrassing, but sometimes users just commit unaccounted errors and may deny or unknowingly dismiss any wrongdoing. The answer is simple, review the functionality and retest to see if its really an issue. Entering an incorrect password is reinforcing the login error message is working correctly. Testing is about being savvy and meticulous, so it’s okay to retest the scenario more than once.
TEST METHODICALLY.
- Take the time to develop a plan of attack on testing the focused area. Eliminate areas that are likely unaffected but include a greater ring of indirect areas that require testing. back to the failed login example, plan around all the web pages that touch the Login module, documenting all the entry points around it. Login usually touches web services, so add tests that touch cloud accounts or any local storage. By creating methodical troubleshooting techniques, this will help navigate your focus to further explore additional areas that are affected and may be the root cause of the issue.
2. CAPTURE LOGS AND TRACE THROUGH ERROR MESSAGES
Bugs that cause application crashes, reboots, black/blue screens, and sudden halting of usage are difficult to quickly assess the root cause mainly because you can’t see what’s happening. Every operating system will have their own way of indicating an application or process crash. Fortunately, there are timestamped log entries and dumps that are saved locally or in the cloud of the incident. When this happens, the basic debugging response is to locate the files, match the timestamps to the time of the crash, and follow the stack trace to the faulting thread that may cause the issue. If you’re new to reading a stack trace, it can be quite intimidating at first since its typically an argument of numbers and letters followed by a bunch of unreadable words:
WARNING: Stack unwind information not available. Following frames may be wrong.ChildEBP
RetAddr Args to Child 71ab4617 3d8151ec 71ac4028 71ab9448 f4840f56 CMGR+0x191c
However, the good news is a lot of these errors can be google’d or setting up troubleshooting techniques with a debugging tool can help a developer narrow down the address of where the problem lies. While it’s not typically the responsibility of a functional tester to decipher the error, it helps tremendously if they can parse through the log and narrow down the section where the error happens:
Example:
--------- beginning of crash
AndroidRuntime: FATAL EXCEPTION: main
Process: com.android.developer.crashsample, PID: 3686
java.lang.NullPointerException: crash sample
at com.android.developer.crashsample.MainActivity$1.onClick(MainActivity.java:27)
at android.view.View.performClick(View.java:6134)
at android.view.View$PerformClick.run(View.java:23965)
at android.os.Handler.handleCallback(Handler.java:751)
at android.os.Handler.dispatchMessage(Handler.java:95)
at android.os.Looper.loop(Looper.java:156)
at android.app.ActivityThread.main(ActivityThread.java:6440)
at java.lang.reflect.Method.invoke(Native Method)
at com.android.internal.os.Zygote$MethodAndArgsCaller.run(Zygote.java:240)
at com.android.internal.os.ZygoteInit.main(ZygoteInit.java:746)
--------- beginning of system
Use a debugging tool to pull up text-based logs in kernel-mode viewing. Simple command line interfaces are most common and quick to access. You can also use developer tools like Android Debug Bridge or WinDbg can provide a GUI for easier viewing and filtering of stack traces.
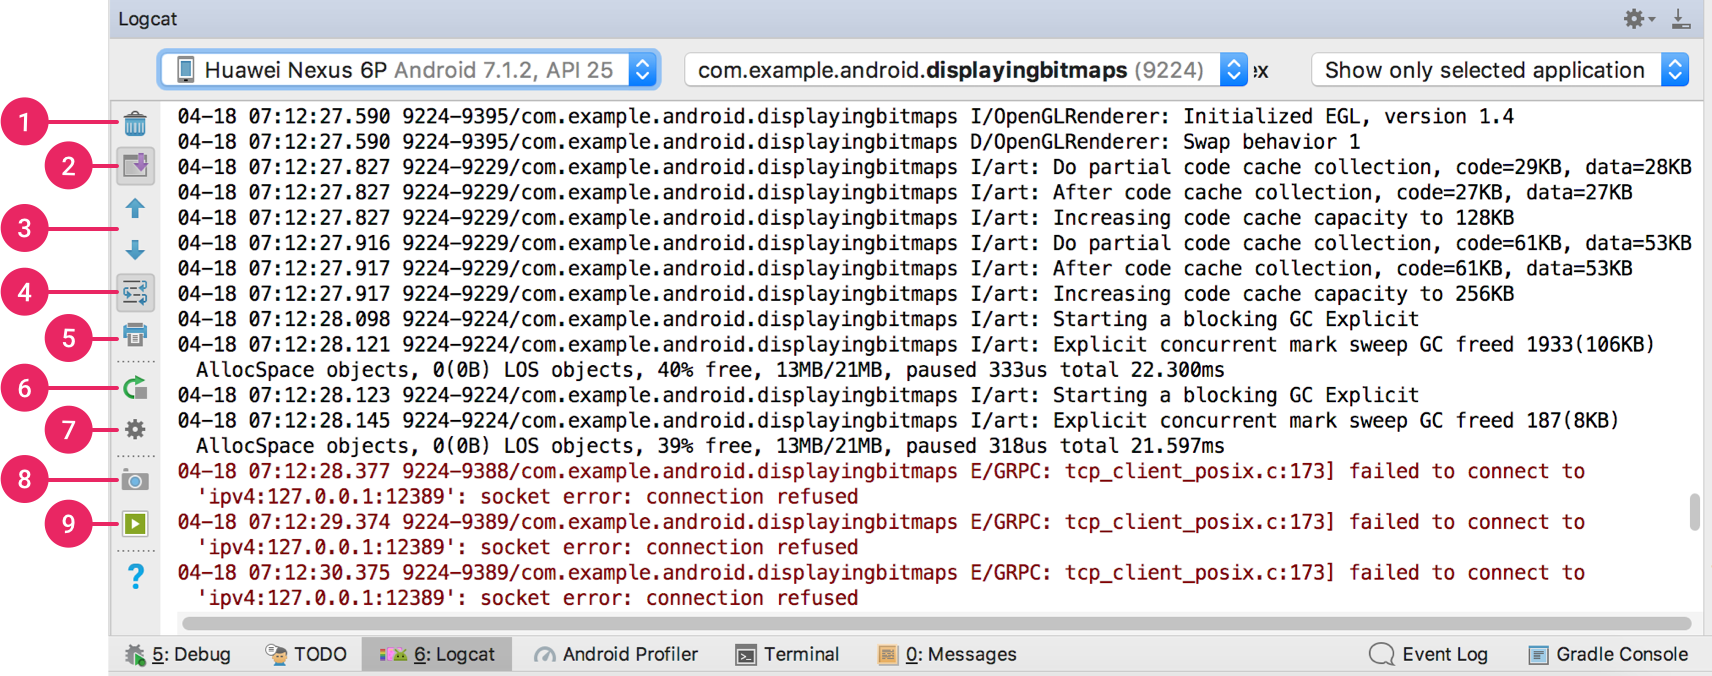
Fig 1: https://developer.android.com/studio/debug/am-logcat
Reading debuggers and logs can take time to learn and familiarize yourself with. But once you have narrowed down the culprit, be sure to provide screengrabs and attachments to support the bugs you are filing. Developers find logs to be quick to narrow down the area of defects, since majority of crashes and hangs are system based and can be traced back through stack trace arguments.
3. TEST ON A MATRIX OF HARDWARE AND SOFTWARE CONFIGURATIONS
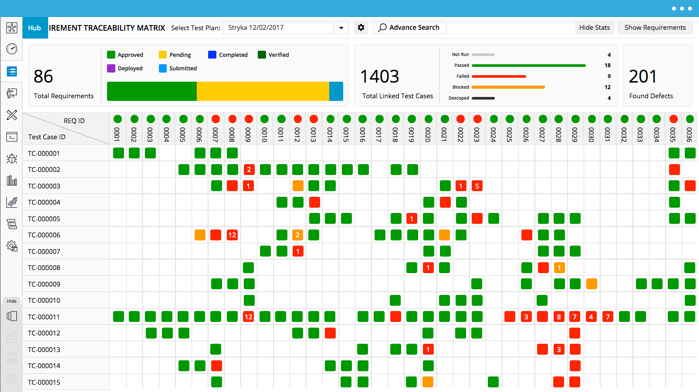
Broad bugs that may have multiple root causes often require casting a wide net before reducing to a centralized area. The best way to sort your thoughts is to create a test traceability matrix to track your environment and progress. This could be used for both hardware and software variations, as some issues can be quickly reproduced in a few common steps, while others may require in-depth edge case testing to narrow down a specific hardware, version, and functional area. A traceability matrix is typically used to manage test case management, but the idea can similarly be used to track down where problems lie. In addition to capturing a bird’s eye view of the different environments to test against, it also can give the tester a summarized progress of testing that’s easy to read and understand. Lastly, you may reuse the matrix for adding future regression or exploratory tests once the issues are fixed.
CONCLUSION
By performing a little due diligence and administering troubleshooting techniques to track down difficult bugs to reproduce, you are saving your company costs, time, and energy from the issues being discovered in the wild. Pre-release testing will always be at a disadvantage to catching bugs because it is unrealistic to ever mimic all the real-world environments and product usage. However, the key to effective testing is to detect and quickly isolate the problem so it can be fixed in a timely manner before its reported by the end users. So, take the extra time to plan, isolate, and educate yourself on difficult bugs and the rewards will be reaped later when a solid product is shipped.